

- Australian Broadband Data Demand report highlights on the main nbn wholesale service:
- Weekly download throughput peak of 14.6 Terabits per second (Tbps) recorded on Saturday, 11 July during the evening busy hours
- Weekly upload throughput peak of 0.93 Tbps recorded on Sunday, 12 July during the evening busy hours
An all-time peak in download data demand was recorded on nbn’s main wholesale access service on Saturday, 11 July, according to new figures from the Australian Broadband Data Demand report.
The record in peak download data demand reflects increased household internet activity as more people stayed home as a result of COVID-19 social distancing requirements, particularly in Victoria, as well as organic internet activity growth with the addition of new customers to the nbn™ network since the beginning of the pandemic. Data demand during the week was also influenced by changes made by some major streaming video services to their video codecs.
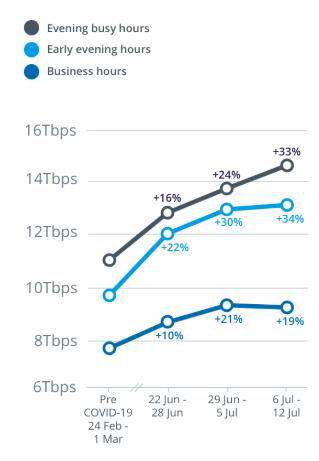
For the week from Monday, 6 July to Sunday, 12 July, peak download throughput (the measure of data flowing through the nbn™ network) during the busy evening period increased by 33 per cent to 14.6 Terabits per second (Tbps) on the main nbn wholesale service, compared to the last week of February (which nbn measures as its normal pre-COVID-19 baseline).
Peak download throughput during the same week also increased during daytime business hours, up 19 per cent to 9.3Tbps, and early evening hours up 34 per cent to 13.2Tbps, compared to the pre-COVID-19 baseline.
Australian Broadband Data Demand is a weekly report into the peak throughput recorded in a week during daytime business hours, early evening hours and busy evening hours.
“We’ve seen data demand grow on the network every year as more customers connect and as they have increased their use of data-intensive services like streaming video. More than 600,000 new customers have joined the nbn™ since February 2020, with the network now helping to support the data requirements of a total of almost 7.5 million customers,” said Brad Whitcomb, Chief Customer Officer at NBN Co.
“Downstream network usage generally peaks in the busy evening period when more people are accessing video streaming and other entertainment services, and demand is higher than during the business hours. We are continuing to monitor data demand to help ensure that the network meets the needs of the nation,” Mr Whitcomb said.
Downstream network usage
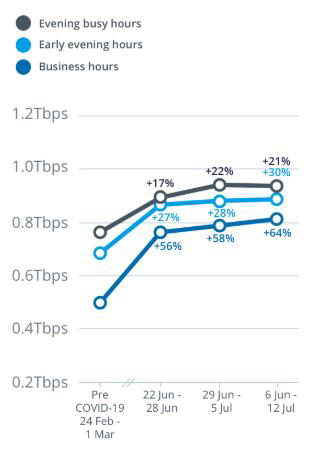
Peak upstream throughput on the main nbn™ wholesale service in the evening busy hours for the week beginning 6 July increased by 21 per cent to 0.93Tbps, compared to the pre-COVID-19 baseline. In the early evening hours, peak upload throughput increased 30 per cent to 0.88Tbps; and peak throughput during daytime business hours increased by 64 per cent to 0.82Tbps, compared to the pre-COVID-19 baseline.
Upstream network usage
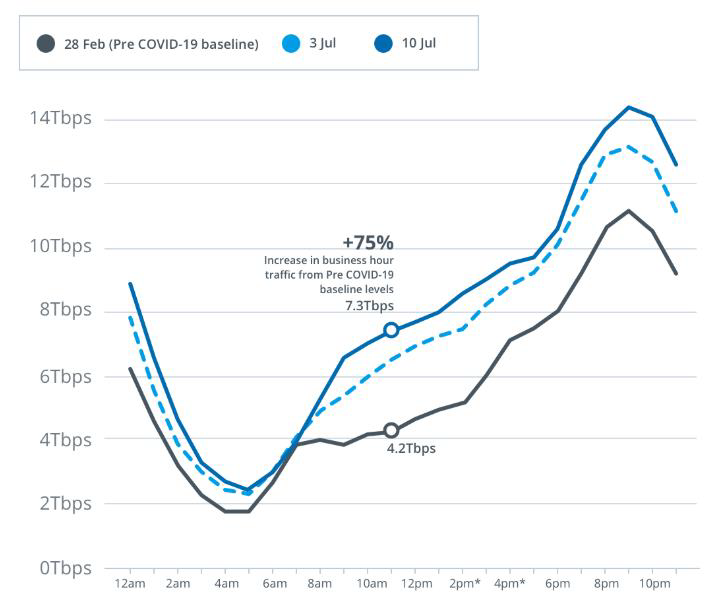
Compared to the pre-COVID-19 baseline before social distancing measures were implemented, downstream network usage on the nbn™ main wholesale service during business hours on 10 July 2020 was 75 per cent higher (as shown in the graph below at 11am) than pre-COVID-19.
Downstream network usage over 24 hours
* The “Downstream network usage” graph in the week of 6 July – 12 July has been calculated using an estimate for the 2pm, 3pm and 4pm readings for Friday 10 July. This is due to a network incident which meant that actual network traffic usage was not captured during that time at a particular Serving Area Module. nbn has generated the estimates using the hourly growth rates from Friday 3 July at 2pm, 3pm and 4pm, and applied those growth rates to the 1pm readings for Friday 10 July. Please treat these graphs with caution when using them for comparison purposes.
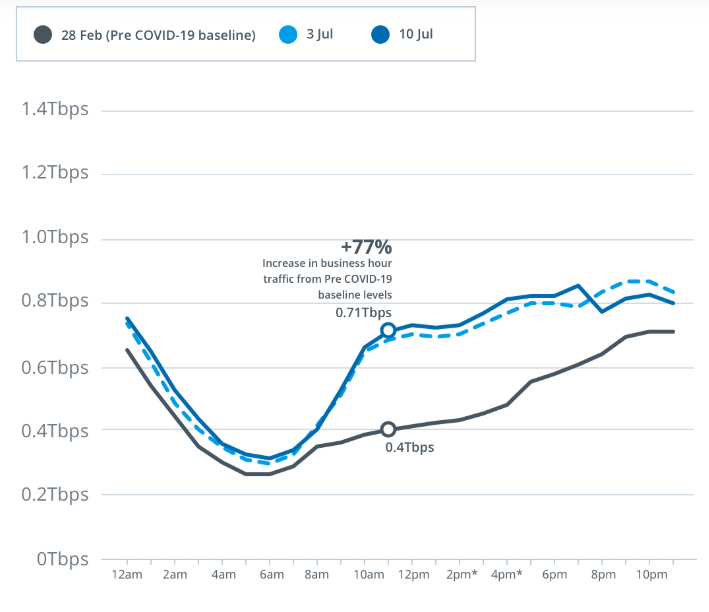
Upstream network usage on the nbn™ main wholesale service during business hours on 10 July 2020 was 77 per cent higher (as shown in the graph below at 11am) than the pre-COVID-19 baseline.
Upstream network usage over 24 hours
* The “Upstream network usage” graph in the week of 6 July – 12 July has been calculated using an estimate for the 2pm, 3pm and 4pm readings for Friday 10 July. This is due to a network incident which meant that actual network traffic usage was not captured during that time at a particular Serving Area Module. nbn has generated the estimates using the hourly growth rates from Friday 3 July at 2pm, 3pm and 4pm, and applied those growth rates to the 1pm readings for Friday 10 July. Please treat these graphs with caution when using them for comparison purposes.